Home - Information Snapshot
The Seysoft home page provides an Information Snapshot of your business with a variety of different charted statistics. These charts are automatically populated based on the information collected regarding your sales, expenses, employees, and inventory. Our system automatically parses this information and the charts are predetermined. As a possible feature update we are considering allowing our users to create their own homepage based charts but currently the charts on the Information Snapshot are already coded in. The charts provided on the homepage are:
- Sales (By the current year)
- Looks for sales that are marked with a status of Paid AND
- Looks for sales that are marked with a payment date
- Sales vs Expenses (Monthly by the current year)
- Looks for sales that are marked as paid with a payment date
- Looks for expenses that are marked as paid with a payment date
- Expenses (By the current year)
- Looks for expenses that are marked with a status of paid AND
- Looks for expenses that are marked with a payment date
- Employee Time off (by the current year)
- Looks at recorded employee time off.
- Low Inventory Items (by category)
- Looks for Inventory items where the stock feature is on AND
- Looks for inventory items where the inventory quantity is less then or equal to 5
- Describes what percentage of this category is low
- Customer Appointments (by the current year)
- Tracks and counts appointments by month for the current year
- Top 10 Sales by Product (by the current year)
- Tracks the most sold inventory items
- Sales must be attached to an inventory item AND
- Sale must be marked as paid AND
- Sale must have a payment date
- Sales minus Expenses (by the current year)
- Looks at sales that have a status marked as Paid AND
- Looks at sales that have a payment date AND
- Looks at expenses that have a status marked as Paid AND
- Looks at expenses that have a payment date AND
- Subtracts the expenses from the sales to show month by month for the current year
- New Customers Added (by the current year)
- Looks at the internal time stamp for when you added a new customer into the system.
- Counts those added customers by month for the current year
- Sales Unpaid (by sales that have a status of pending or on hold)
- Looks for sales that have a status of Pending or On Hold AND
- Looks at the internal timestamp to see when they were entered and how long it has been
- Expenses by Inventory Item
- Looks for expenses that are attached to inventory items
- Year over Year Sales (sales from last year compared to sales of the current year)
- Looks for sales that are marked with a status of Paid AND
- Looks for sales that are marked with a payment date AND
- Checks the sales by payment date for last year and the current year
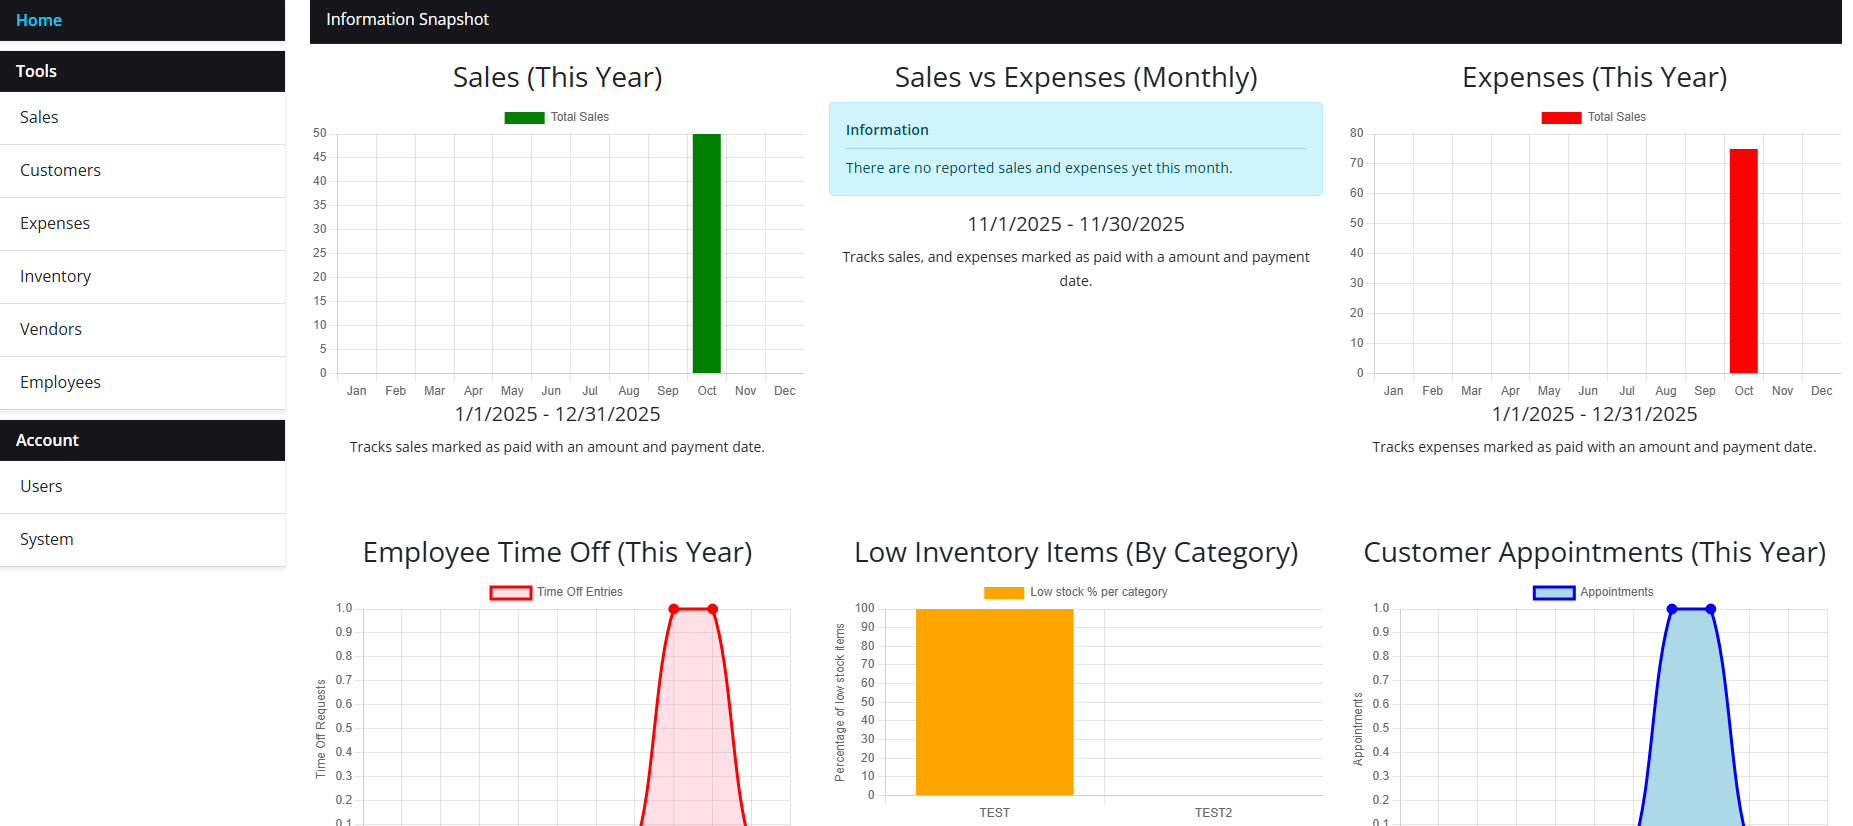
Below is a screenshot example of the homepage. As you can see there is a title for what the chart reflects, and a description that will usually feature the time frame range with additional information if it is available. If that information cannot be parsed into a chart you will see a Blue Information box that will tell you why it cannot do so.